Dr. Egon Dejonckheere
Egon does research in Emotion, Clinical Psychology and Abnormal Psychology. His most recent publication is 'The Bipolarity of Affect and Depressive Symptoms', featured in Journal of Personality and Social Psychology: Personality Processes and Individual Differences.
How to run an EMA or ESM study
Accordingly, design decisions in EMA or ESM directly shape your data. How you phrase your items, how many questions you include, how often you sample, and how long the study runs, all determine what you will observe. Sample too infrequently and you miss short-term dynamics. Make surveys too long and participants may skip or rush through them. These choices influence how participants engage with your study and, ultimately, the conclusions you can draw.
Relatedly, setting up an EMA or ESM study is also not necessarily a linear process, but often requires multiple iterations. Decisions made at later stages may frequently force you to revisit earlier ones. Increasing sampling frequency may require shortening your survey. Extending study duration may require reducing burden in other ways. In practice, you move back and forth between design choices until all components align with your research question and remain feasible for participants.
This guide walks you through how to run an EMA or ESM study from start to finish. It covers the key design choices and trade-offs, while offering concrete handles to tailor each step to your specific research question.

Step 1: Define your EMA or ESM research question
Time scale
Momentary constructs
Other sources, such as theoretical frameworks, prior EMA or ESM publications, pilot data, qualitative interviews (e.g., with participants, relevant stakeholders or domain experts), and dedicated EMA or ESM item repositories can be equally valuable for defining momentary constructs.
Articulate your research questions
If you skip this step or define your research questions vaguely, everything that follows becomes guesswork. The clearer you are here, the easier it becomes to make good decisions in the rest of the study design.
Step 2: Design your EMA or ESM survey
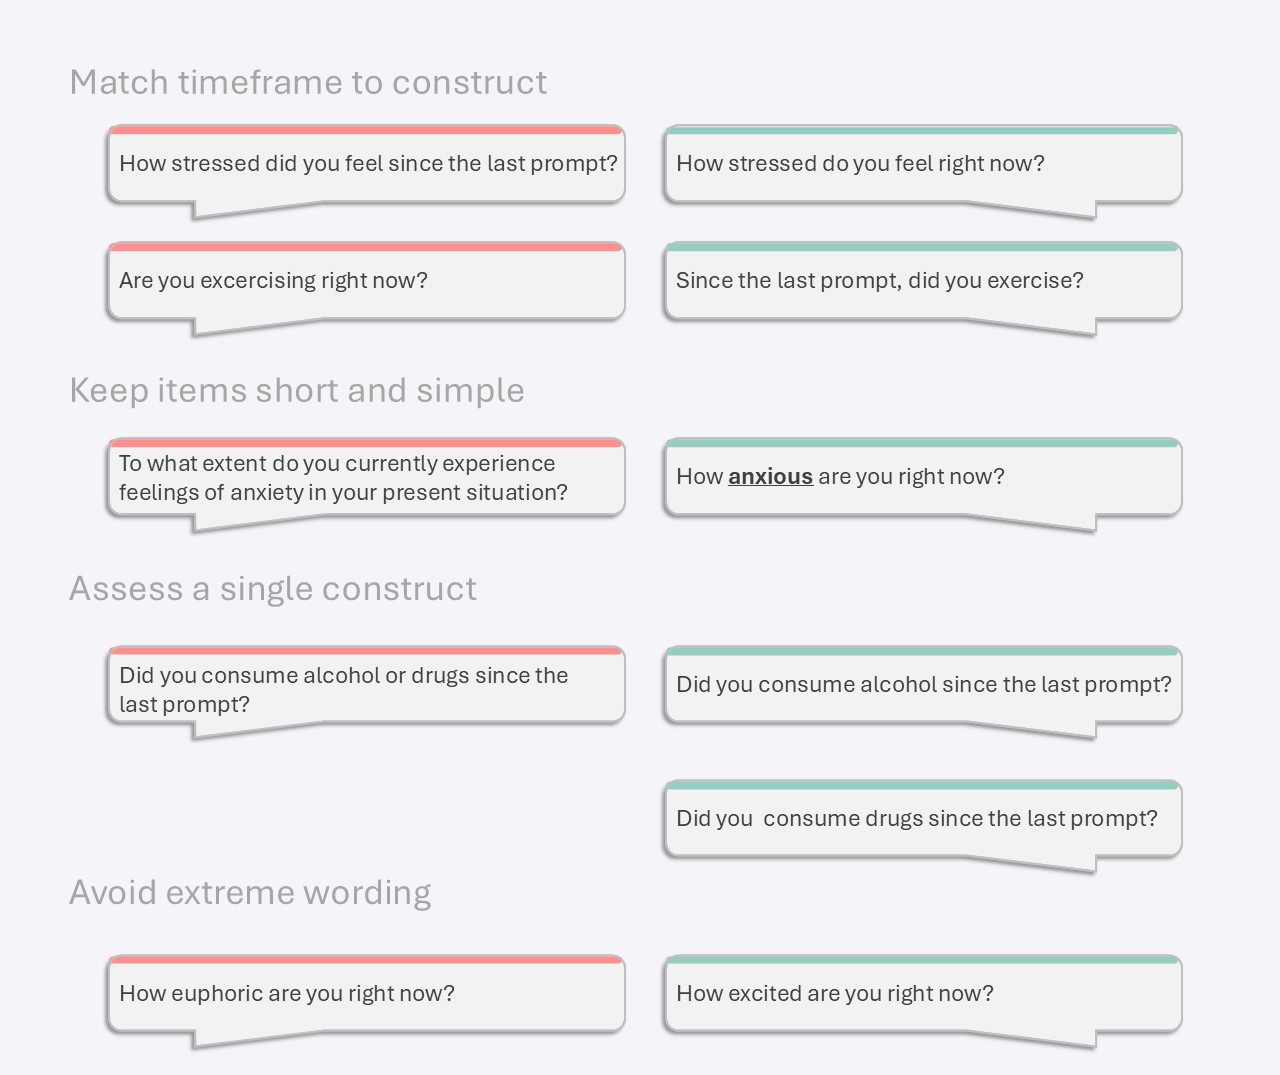
Item formulation
But how do you decide which timeframe is most appropriate? Items phrased as “right now” capture the participant’s current state and are ideal for rapidly fluctuating processes such as mood or stress, while minimizing recall bias. In contrast, “since the last prompt” or "in the last hour" refer to a time interval and are more appropriate for events or behaviors that may not occur exactly at the moment of the prompt, such as social interactions, specific behavior or episodic experiences. However, these interval-based items are more susceptible to recall bias. Essentially, the choice should follow the construct: use “right now” for momentary states, and “since the last prompt” for processes that unfold over time or occur intermittently.
Another recommendation is to keep items short and cognitively simple. Participants should be able to read and answer them in a few seconds. You can use text formatting to highlight the core construct if needed. Avoid long sentences, extreme wording that is not sensitive to temporal change, double-barreled questions, or reversed-coded items.
How to design (and evaluate) good-quality items in EMA or ESM is also explained in detail in this blogpost.
Questionnaire design
First, limit the number of items in your survey. It is tempting to “just add a few extra questions” while you have access to participants in daily life. However, in EMA or ESM this quickly becomes problematic. Every additional item increases burden, and higher questionnaire density may be associated with lower compliance and reduced data quality. A simple rule: only assess what you will actually analyze. If a variable is not central to your research question, it likely does not belong in your momentary survey. It is better to measure a few key constructs well than to dilute data quality across many variables.
A closely related decision is whether to use single-item or multi-item measures. Single-item measures minimize completion time and are therefore well suited when multiple constructs need to be assessed, but their reliability cannot be evaluated via internal consistency (although a test-retest approach may be used). In contrast, multi-item measures allow for the assessment of internal consistency and provide greater construct coverage, but increase survey length and may reduce attentive responding.
With respect to structure and ordering of items within a survey, it is common practice to place the most central and time-sensitive items early in the questionnaire, when participants are most attentive and least influenced by earlier questions. This is especially important for constructs that may be reactive or easily influenced by reflection, such as mood or stress. More contextual or descriptive items (e.g., location, activity, social context) can follow afterward.
Randomizing item order across prompts can help reduce order effects, but it may also increase cognitive load for participants. In many cases, it is preferable to keep a stable structure and group items with similar response formats together. Switching between different scales or formats requires additional effort and slows participants down, which can negatively impact data quality in repeated assessments.
If you use branching (conditional questions), keep different paths roughly equal in length and complexity. If one branch is noticeably shorter or easier to complete, participants may learn this and preferentially select that option to reduce effort. This can introduce systematic bias in your data, as responses may reflect survey navigation rather than actual experience.
Temporal properties
A first key parameter is the expiration window: the time frame within which a questionnaire remains available after a prompt. Short expiration windows increase temporal precision and ensure that responses closely reflect the intended moment, but may reduce compliance. Longer windows improve response rates, yet allow participants to answer retrospectively, weakening the momentary nature of the data.
A second element is the use of reminders. Follow-up notifications can substantially increase compliance, especially in intensive designs. However, reminders often recover delayed responses, which may systematically differ from immediate responses in both timing and content. In addition, frequent or poorly timed reminders may induce annoyance or notification fatigue, which can reduce engagement over time or even lead to disengagement from the study altogether.
A third parameter concerns completion windows: once a questionnaire is opened, how much time participants have to complete it (or individual items). Short completion windows encourage immediate, focused responding and reduce the risk of interruptions or retrospective answering. In contrast, longer or unrestricted completion windows increase flexibility, but allow participants to pause, multitask, or resume later, which can introduce noise and weaken the link to the intended moment of assessment.
Taken together, these temporal properties define the effective measurement window of each assessment and should be calibrated in line with the volatility of the construct and the level of temporal precision required by the study. In practice, these settings determine whether your data reflect momentary states, recent retrospections, or a mixture of both.
Step 3: Design your EMA or ESM sampling protocol
These parameters jointly determine two things: what you can capture (temporal resolution and coverage of daily life) and how demanding the study is for participants (burden). Importantly, these dimensions are in tension. Increasing sampling frequency improves temporal resolution, but also increases burden. Extending study duration improves coverage, but raises the risk of fatigue and dropout.
Because of participant burden, the optimal choice for each parameter depends on the others. You cannot decide on assessment frequency, study duration, or sampling scheme in isolation. Instead, they need to be evaluated together as one design problem, where adjusting one parameter often requires adapting the others in light of study burden. The goal is therefore not to optimize each parameter separately, but to find a balanced combination that allows you to answer your research question while remaining realistic for participants.
Study duration
When ecological validity is critical to your research question, a practical recommendation is to include at least one full week of assessment. Weekdays and weekends often differ substantially in routines, activities, and social contexts, and capturing both is important for obtaining a representative picture of daily life.
Another key consideration is the base rate of the phenomenon you are studying. If you are interested in relatively rare or episodic events, such as the onset of a depressive episode or relapse processes, you will need a longer study duration to ensure that these events are captured. In contrast, for frequently occurring processes such as social interactions or momentary emotions, shorter study periods may already provide sufficient information.
At the same time, longer studies come at a cost. They increase participant burden over time, which can lead to fatigue, reduced compliance, or dropout. Shorter studies are easier to complete and may yield higher response rates, but miss slower processes or provide less stable estimates of individual patterns.
Assessment frequency
A useful way to think about this is: what changes between two prompts? If nothing meaningful is expected to change, your sampling frequency is too high. If important changes can occur between prompts, your frequency is too low.
It is equally important to define the start and end of the sampling day. Prompts should fall within participants’ typical waking hours. For example, it does not make sense to start sampling university students early in the morning when they are likely still asleep, or to schedule prompts late at night for younger kids who are already in bed. Increasingly, studies tailor these windows to the individual participant’s daily rhythm, which may improve both compliance and ecological validity.
Closely related is the inter-prompt interval, or the time between consecutive prompts. This is not only a practical consideration, but also a statistical one. If prompts are spaced too far apart, you may miss the temporal dynamics you aim to study. If they are too close together, responses may become redundant and burdensome. Especially when analyzing temporal relationships (e.g., lagged effects or autocorrelation), you need intervals that are short enough to capture meaningful change.
As with study duration, increasing sampling frequency comes at a cost. More prompts increase participant burden and can lead to lower compliance or more superficial responding. Higher frequency therefore only improves data quality if participants can realistically keep up with the protocol.
Sampling scheme
A key distinction is between time-based and event-based sampling. In time-based designs, participants are prompted at predefined moments throughout the day, regardless of whether specific events occur. These designs are well suited for capturing ongoing processes such as mood, symptom fluctuations, or stress levels. Within time-based sampling, you can choose between fixed, random, and semi-random schedules.
- Fixed schedules use the same times each day and are predictable, which can improve compliance but may introduce anticipation effects that alter behavior or experiences. They can also lead to situation selection bias, as fixed prompts may consistently coincide with the same routine activities, resulting in certain contexts being overrepresented in the data.
- In contrast, fully random schedules increase unpredictability and reduce selection bias or behavioral adaptation effects, but can feel more intrusive and lead to uneven coverage of the day. They are usually not recommended.
- In practice, when ecological validity is important to your research question, semi-random schedules are most commonly used. Here, prompts are randomly scheduled within predefined time windows. This ensures good coverage of the day, avoids certain contexts being overrepresented in the data, and maintain some unpredictability to avoid behavioral adaptations.
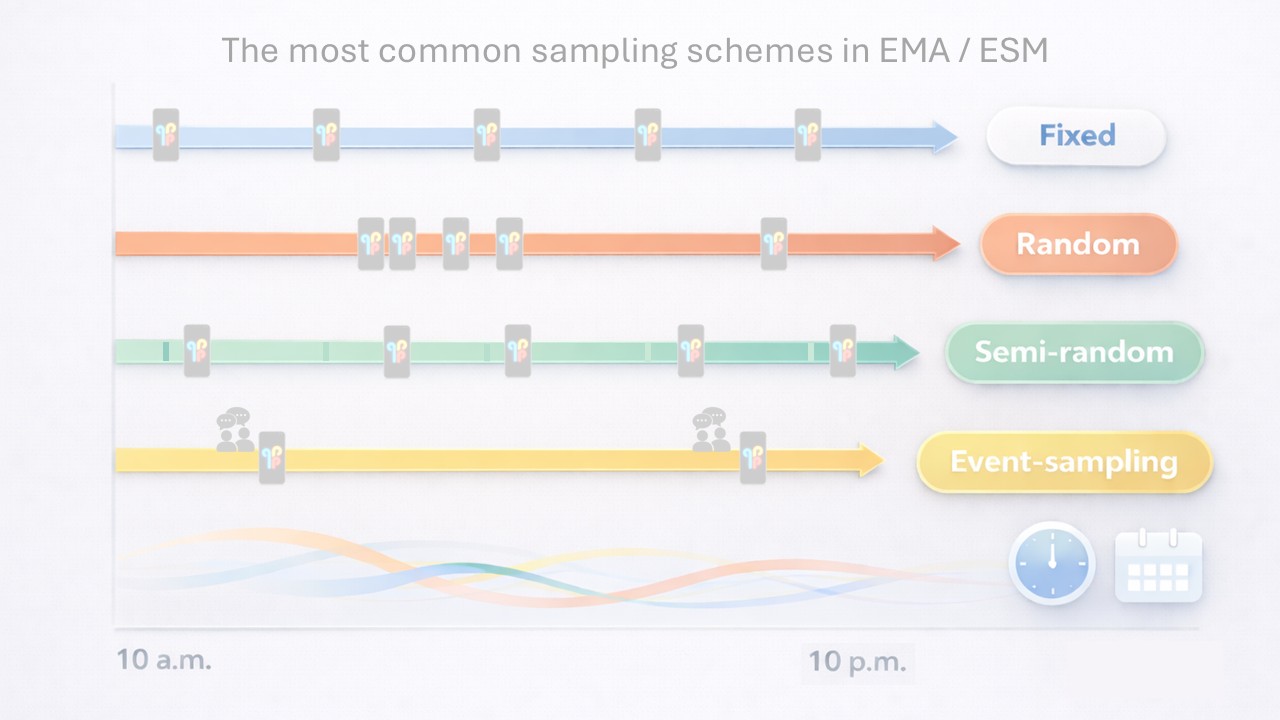
In event-based sampling designs, participants initiate a report themselves when a predefined event, such as a social interaction, craving episode, or symptom flare-up occurs. This approach is particularly useful for infrequent or context-specific events, as it avoids unnecessary prompts. It is also the preferred approach when the research question focuses on experiences following a specific event, such as emotional responses after a conflict. Nevertheless, event-based sampling relies on good participant engagement and awareness, and may therefore introduce bias.
In practice, you can combine multiple approaches: time-based sampling to capture the general flow of daily life, and event-based sampling to target specific, meaningful moments. A discussion of other (hybrid) sampling schemes can be found here.
Finally, as with other design decisions, the sampling scheme should be considered together with sampling frequency, study duration, and survey burden to form a coherent and feasible design.
Align design choices and evaluate trade-offs
A useful starting point is to think in terms of total daily burden. How much time are participants expected to spend on your study per day? Is this realistic given the population you are interested in, their daily routines, and sustainable over the full study duration? Small increases in survey length or sampling frequency can quickly accumulate into a substantial burden when repeated many times.
Next, look for mismatches between design choices. For example, a high sampling frequency combined with a long questionnaire is unlikely to be feasible. Similarly, if your research question requires a long study duration, it needs a lower daily burden to prevent fatigue and dropout. These trade-offs are unavoidable and need to be explicitly managed. It’s a back-and-forth process to arrive at a well-calibrated design. In practice, this often requires several iterations before arriving at a design that is both scientifically sound and practically feasible.
Step 4: Pilot your EMA or ESM study
First, use the pilot to identify technical issues. Check whether notifications are delivered at the moments you specified, whether survey content loads correctly, whether branching works as defined, and whether timestamps and data are recorded accurately. Small technical problems can quickly compromise data quality if not detected early.
Second, evaluate quantitative indicators of feasibility. Monitor compliance rates, response delays, completion times, and patterns of missing data. Are participants responding consistently throughout the day and across days? Do certain time windows show systematically lower response rates? These indicators provide an objective sense of whether your design is sustainable.
Third, gather qualitative feedback from participants. Ask how they experienced the study: Were the questions clear? Did the survey feel too long or repetitive? Were notifications intrusive or poorly timed? Participants often reveal issues that are not visible in the data alone, such as subtle confusion, measurement reactivity or irritation.
Finally, a pilot can also inform sample size planning. The observed variability, compliance rates, and effect sizes in your pilot data can be used as input for a simulation-based power analysis. This allows you to make more realistic estimates of the sample size needed for your main study, as the multilevel nature of EMA or ESM data makes analytical power calculations infeasible.
Step 5: Run and monitor your EMA or ESM study
Start with a strong intake procedure. Make sure participants clearly understand what is expected of them: how often they will be prompted, how to respond, that it is not a problem if they occasionally miss an assessment, but also why their compliance matters. A brief onboarding or training session can prevent many issues later. This is also the moment to align expectations about effort, duration, and potential compensation.
During the study, closely monitor compliance patterns. Track response rates, missed prompts, and completion times. The key is not just to observe, but to decide in advance how you will act on this information. For example, will you contact participants if they repeatedly miss prompts or have unusually fast completion times? Will you send reminders or provide support? Having a clear strategy helps maintain consistency and avoids ad hoc decisions.
Maintain ongoing communication with participants. Regular check-ins, reminders, or brief messages can help sustain engagement, especially in longer or more intensive studies. At the same time, communication should be balanced to avoid becoming intrusive. A strong researcher-participant alliance is essential for maintaining engagement and data quality.
Finally, include a proper debriefing at the end of the study. This is an opportunity to gather feedback on participant experience, identify issues that were not visible in the data, and understand how the study was perceived. Debriefing can provide valuable insights for interpreting results afterwards, and improving future designs.
Step 6: Preprocess and analyze your EMA or ESM data
Preprocessing
Next, evaluate compliance. Examine response rates per participant and across time. Decide in advance how to handle low-compliance cases, for example by setting inclusion thresholds or conducting sensitivity analyses. Investigate missing data patterns within participants. Missingness in EMA or ESM may not be random. Check whether missed prompts cluster at specific times of day, days of the study, or contexts. This helps identify potential biases in your data.
Also assess average response latency, completion time and careless responding. How long do participants take to respond after aprompt, and how long do they take to complete a survey? Long delays may indicate that responses no longer reflect the intended moment, while extremely fast responses may indicate superficial or careless answering. Other indicators of careless responding include invariant responses (e.g., always selecting the same response), or inconsistent answering (e.g., feeling stressed and relaxed at the same time). These observations may need to be flagged or excluded depending on your criteria.
The ESM preprocessing gallery can help you gain insight in your dataset.
Assumptions and structure
First, consider the time structure of your data. Many temporal analyses assume observations are equally spaced, but in practice EMA or ESM data often contains irregular intervals due to (semi-)random sampling, missed prompts or night-time intervals. Depending on your analytical approach, you may need to explicitly account for unequal spacing or approximate equal intervals through time windows. Ignoring this can distort estimates of temporal dynamics.
Second, evaluate stationarity. Many models assume that the underlying processes are stable over time, meaning that relationships between variables do not systematically change across the study period. In reality, this assumption may be violated due to habituation, intervention effects, or external events. It is therefore important to assess whether dynamics remain relatively constant or vary over time.
Third, account for the nested structure of the data. EMA or ESM data consists of repeated observations nested within individuals, meaning that within-person and between-person variation are fundamentally different sources of information. Appropriate models, such as multilevel models, are needed to separate these levels. Ignoring this structure can lead to biased estimates and incorrect inferences.
Dr. Egon Dejonckheere
Egon Dejonckheere is an Assistant Professor at Tilburg University, affiliated with KU Leuven, specializing in ambulatory assessment and intensive longitudinal research. His work combines methodological innovation to improve these methods with applications in mental health and emotion dynamics, and includes dozens of smartphone-based studies in daily life.

FAQ
01.
EMA or ESM is most suitable for research questions that target within-person processes in daily life. It is particularly useful when you want to study fluctuations, context-dependent experiences, or temporal sequences as they unfold in real-world settings.
02.
Keep items short, clear, and easy to answer within a few seconds. Ensure they are specific enough to be meaningful in the moment, yet general enough to apply across different daily-life contexts, while avoiding extreme, complex or double-barreled phrasing.
03.
“Right now” is best suited for capturing immediate states and reduces reliance on memory. “Since the last prompt” is more appropriate for events or behaviors that occur over a time interval, but introduces a greater risk of recall bias.
04.
Limit the number of questions to what is strictly necessary. Even small additions can substantially increase burden when repeated multiple times per day, which may reduce both response rates and data quality.
05.
Prioritize key variables by placing them early in the survey, when attention is highest and measurement reactivity lowest. Maintain a consistent structure across assessments and group similar response formats to minimize effort and reduce response friction. Avoid highly uneven branches when conditional logic is used.
06.
Short expiration windows ensure responses are close to the intended moment, increasing temporal precision. Longer windows improve compliance but allow participants to answer retrospectively, which weakens the momentary nature of the data.
07.
Reminders can substantially increase compliance, especially in intensive designs. However, they often recover delayed responses and may introduce annoyance or notification fatigue if overused, which can reduce engagement over time.
08.
Short completion windows encourage immediate, focused responding and reduce interruptions. Longer or unrestricted windows give participants flexibility but allow pausing or multitasking, which can introduce noise and weaken the link to the intended moment.
09.
Study length should reflect both the research objective and the expected frequency of the phenomenon. Longer durations improve representativeness and capture rare events, but also increase the risk of fatigue and dropout.
10.
Sampling frequency should match the speed of the process you aim to capture. A useful check is to consider what you expect to change between two assessments: if little changes, you are oversampling, whereas missed transitions indicate undersampling.
11.
Choose a sampling scheme based on how and when the phenomenon of interest occurs. Time-based sampling works well for ongoing processes, with semi-random schedules often preferred to balance coverage and unpredictability. For rare or event-specific phenomena, event-based sampling can be more efficient, and in many cases a combination of both provides the most complete picture.
12.
These parameters are interdependent and should be calibrated together. Increasing sampling frequency or study duration increases burden, which can lead to fatigue or dropout. A feasible design typically requires trading off intensity in one dimension against another.
13.
Consider the total daily burden imposed on participants, including survey length and number of prompts. Small increases can quickly accumulate, so designs that seem reasonable in isolation may become unrealistic when combined. Iteration is often necessary to reach a workable balance.
14.
Piloting helps identify technical issues, evaluate compliance and burden, and gather participant feedback that can reveal problems not visible in the data. It also informs sample size planning.
15.
Start by organizing the data in a long format with correctly aligned timestamps. Then evaluate data quality by checking compliance rates, missingness patterns, response delays, and completion times, as these can reveal bias or inattentive responding that should be handled before analysis.
16.
EMA / ESM data require models that account for repeated observations nested within individuals. You also need to consider unequal time intervals between prompts and whether processes remain stable over time, as violations of these assumptions can affect the validity of your inferences.