

Three ways to give personalized feedback in ESM / EMA studies.
TL;DR
Personalized feedback in experience sampling (ESM) / ecological momentary assessment (EMA) research can range from simple in-app graphs to fully customized dashboards. Participants value seeing their own data, even though most feedback does little to boost compliance. The bigger challenge is getting people to actually look at it. Feedback therefore needs to be easy to access, useful, and tailored enough to reveal something worth seeing. Timing matters too: in observational research, feedback-induced reactivity during the study may be undesirable. In blended care research, reflection and change may be exactly what you want to study.
Your participants completed 70 momentary surveys in a week. Then the study ends.
Do they get anything back from all that data?
In experience sampling (ESM) / ecological momentary assessment (EMA) research, personalized feedback offers one way to make participants' efforts useful to them too. You can show them how their mood changed, when stress peaked, or which experiences tended to occur together.
As discussed in a previous blog, you probably should not see personalized feedback mainly as a compliance strategy. Participants appreciate receiving it, but that appreciation does not necessarily translate into answering more prompts.
A possible explanation is that people do not necessarily look at the feedback you provide. Previous research found that many participants never open their feedback at all, while others spent little time reviewing it.
So if you give participants something back, make it worth looking at. That implies showing more than a generic graph. Useful feedback should highlight relevant patterns, add context, or focus on what is most distinctive for that individual.
And depending on your study goals, you may want participants to do more than simply look. In blended care research, feedback should support reflection, insight, or conversations with a clinician. In observational research, those same effects may create unwanted measurement reactivity.
So what are your options in m-Path?
1. Standardized feedback: Show participants their ESM / EMA responses
The easiest approach is to show participants the data they already provided.
Imagine someone answers "How tense are you right now?" several times each day. After a week, they may wonder whether their tension changed over time or whether some days were clearly worse.
With built-in app visualizations, m-Path researchers can make selected ESM / EMA variables visible directly in the app. Participants complete their assessments and view their own responses in the same place.
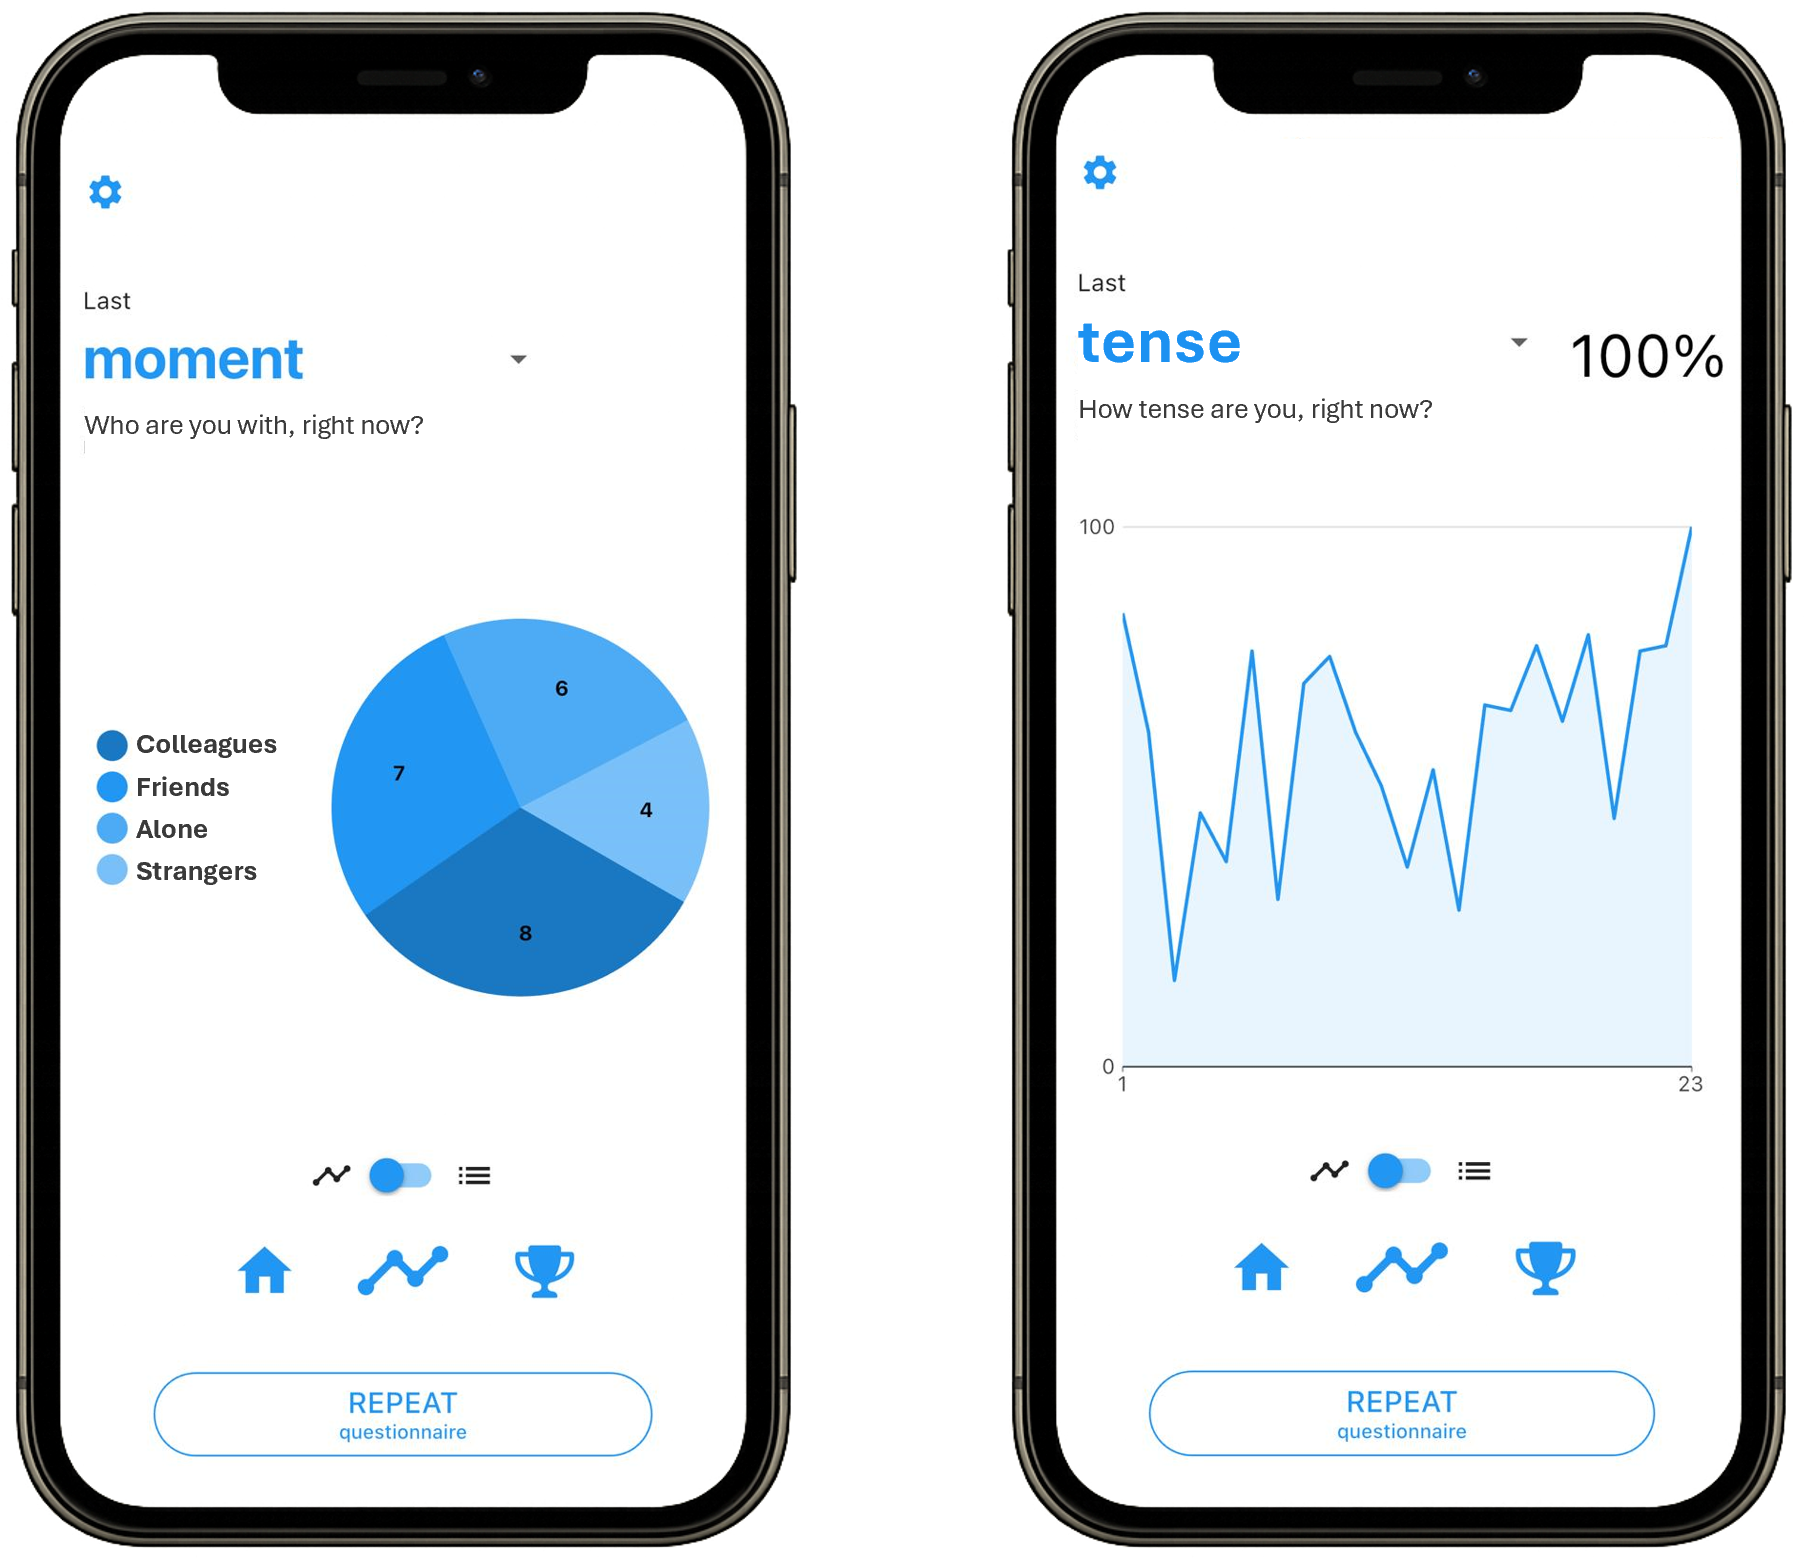
Standardized graphs in the m-Path app's 'visualize' tab.
The big advantage is simplicity. You do not need custom code or a separate analysis pipeline. Once visualization is allowed, the same feedback can be generated automatically for every participant. That makes built-in graphs useful when your main goal is simply to give something back.
But simplicity has limits. Imagine seeing 70 dots representing your tense scores over one week. There may be an interesting pattern, but would you immediately spot it? Probably not.
A graph that looks informative to a researcher may tell a participant surprisingly little. This matters when you want people to engage with their feedback rather than briefly glance at it.
Showing data is not the same as creating insight.
If participants need help seeing what matters, you may need to do more of the analytical work for them.
2. Custom feedback: Highlight individual patterns with R-based graphs
Suppose a participant reports both appetite and mood. You could show two separate graphs. Or you could ask a more useful question: Was this person's mood generally worse when they were hungry?
As a researcher, you can add a small code snippet to your m-Path survey that generates a personalized graph in real time, using the participant data available at that moment. The graph is based on simple R-like computations you already defined in your survey.
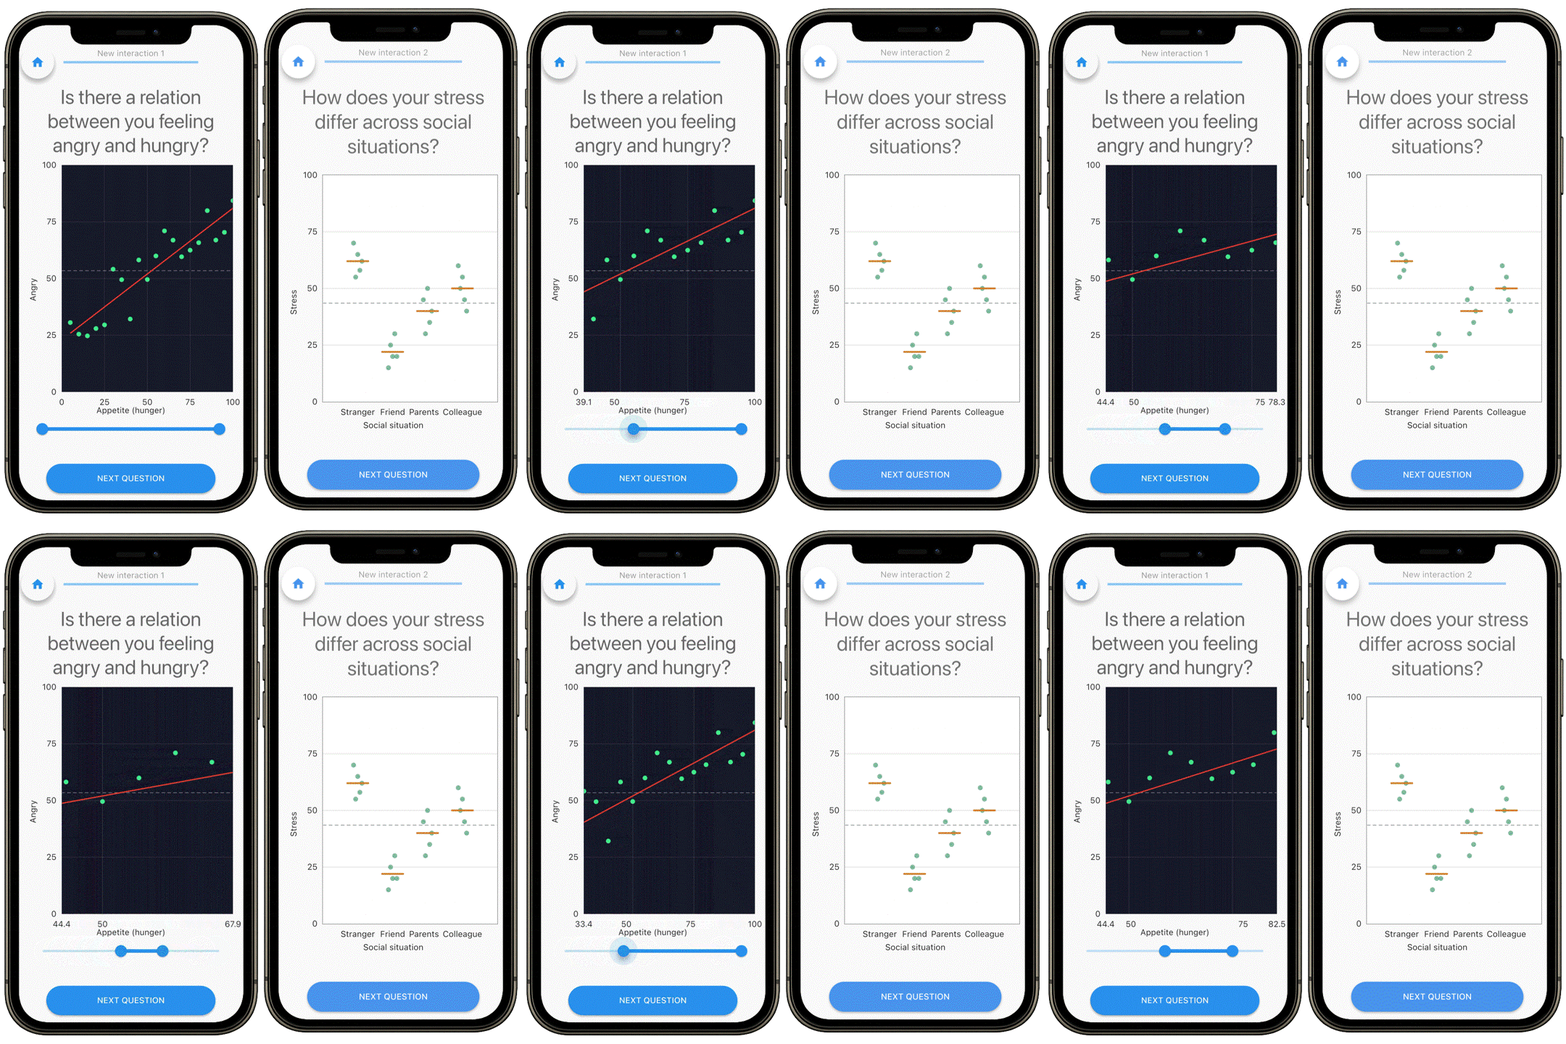
Custom-made graphs in the m-Path app promoting participant insight in ESM / EMA data.
Here, you move from showing responses to highlighting patterns.
For example, you may visualize:
- mood after better versus worse sleep
- stress across different social situations
- changes in emotion after different coping strategies
- differences between weekdays and weekends.
Participants no longer have to search through dozens of observations themselves. You can direct their attention towards something that may actually be informative.
This also allows feedback to differ between people. Tailoring gives you more opportunities to make feedback personally relevant.
But there is a methodological catch. A pattern in someone's ESM / EMA data does not imply causality. If feeling hungry coincides with a bad mood, your feedback should not suggest that hunger necessarily caused that difference.
You also need to decide how much data are needed before showing a result. What happens when the pattern is weak or if there are few observations? Should you communicate uncertainty?
More personalization requires more careful interpretation.
For many studies, custom feedback with pseudo-R offers a useful middle ground. It provides much more flexibility than standard graphs without requiring a complete feedback dashboard.
3. Personalized dashboards: Turn ESM / EMA data into insights
But sometimes one graph is not enough.
If personalized feedback plays a central role in your research, you may want to combine several findings. A personalized dashboard on a desktop can combine different types of data.
Imagine someone collects information on mood, stress, sleep, social interactions, and physical activity. Rather than presenting five disconnected graphs, you can bring selected patterns together in a personalized feedback dashboard.
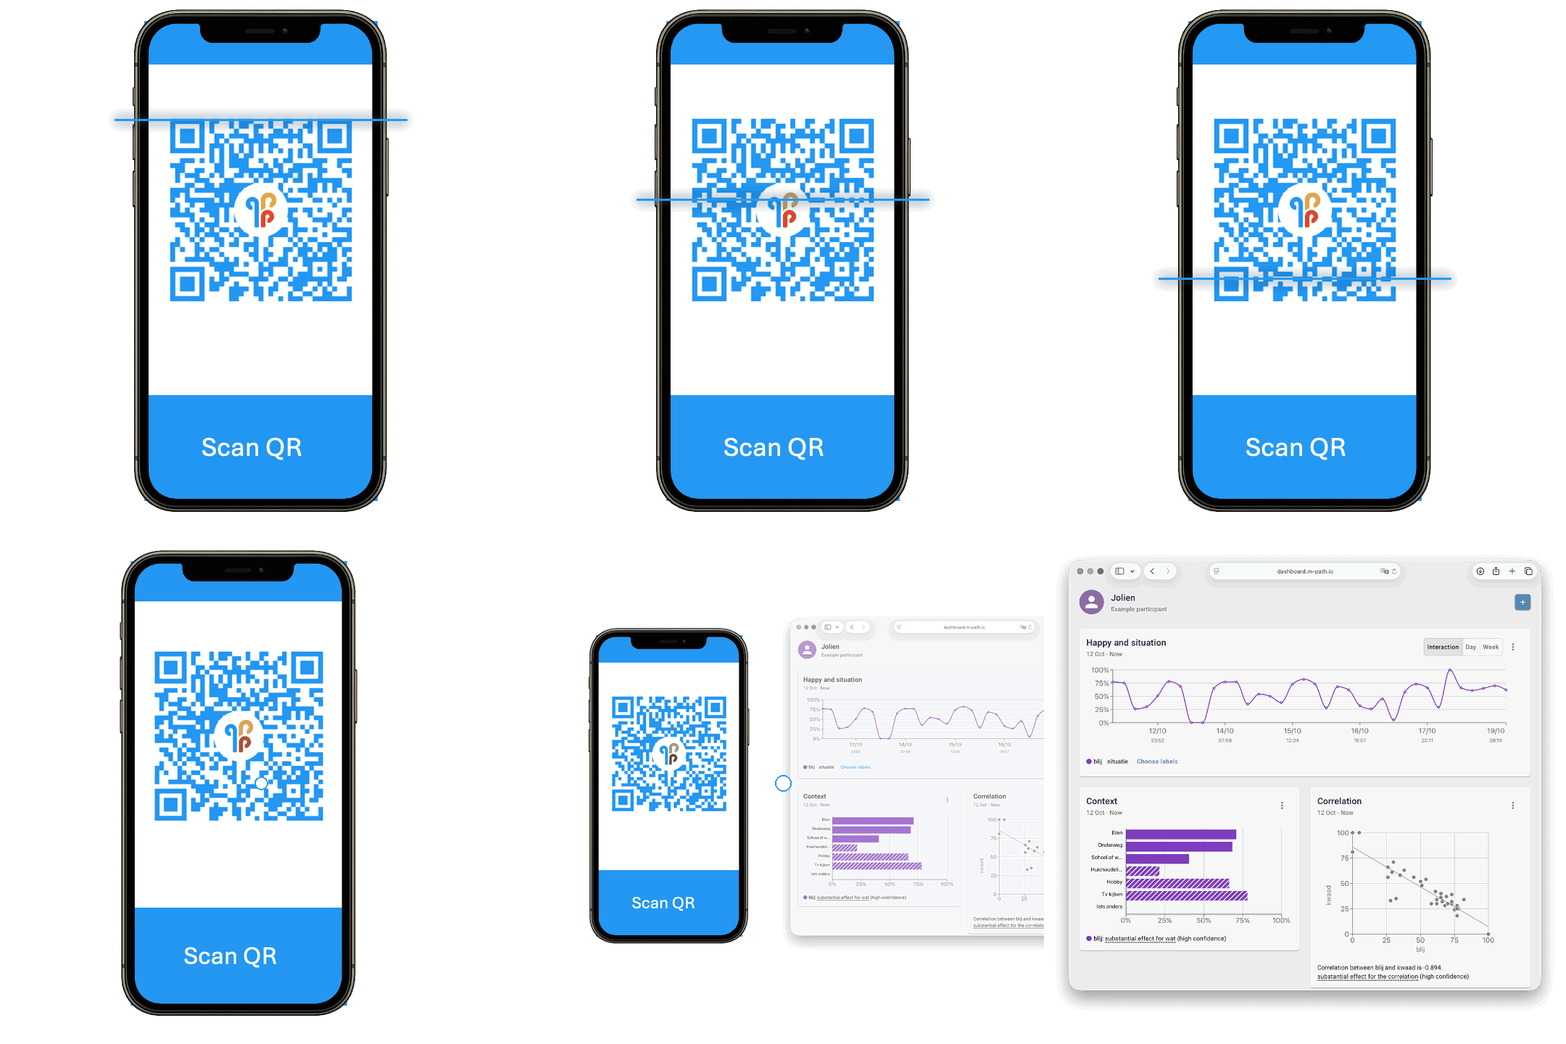
Accessing a curated feedback moodboard in the online m-Path dashboard.
This is particularly interesting in blended care ESM / EMA research. Participants can access their personalized moodboard themselves by scanning a QR code with the m-Path app. The researcher or practitioner can predefine which graphs, summaries, and interpretations are shown, helping participants focus on patterns that matter for the study or intervention.
For example, the dashboard may highlight that happiness tends to increase in certain social situations. Participants can explore that insight themselves or use it as a starting point for a conversation with a practitioner.
The interesting part may be what happens because they saw it. Does it trigger reflection? Does the participant recognize something they had not noticed before? Does it make the clinical conversation more focused?
A personalized dashboard gives researchers much more freedom to design feedback around these processes.
Of course, a sophisticated dashboard can still be ignored. But it gives you more tools to create feedback that is selective, understandable, and genuinely tailored.
Decide whether you want ESM / EMA feedback to induce reactivity
One decision cuts across all three options: when should participants see their feedback?
In observational ESM / EMA research, feedback during data collection may change the process you want to observe.
Imagine a participant notices that their stress is especially high at work. They may start monitoring that stress more closely and avoid certain stressful situations.
If measurement reactivity is a concern, the solution can be simple: collect first and provide feedback afterwards.
In blended care or intervention research, the logic can be reversed.
You may explicitly want participants to recognize patterns, reflect on them, and respond. In that setting, feedback-induced reactivity may be part of the process you want to study.
Here, you want to give participants access to feedback during the ESM / EMA study.
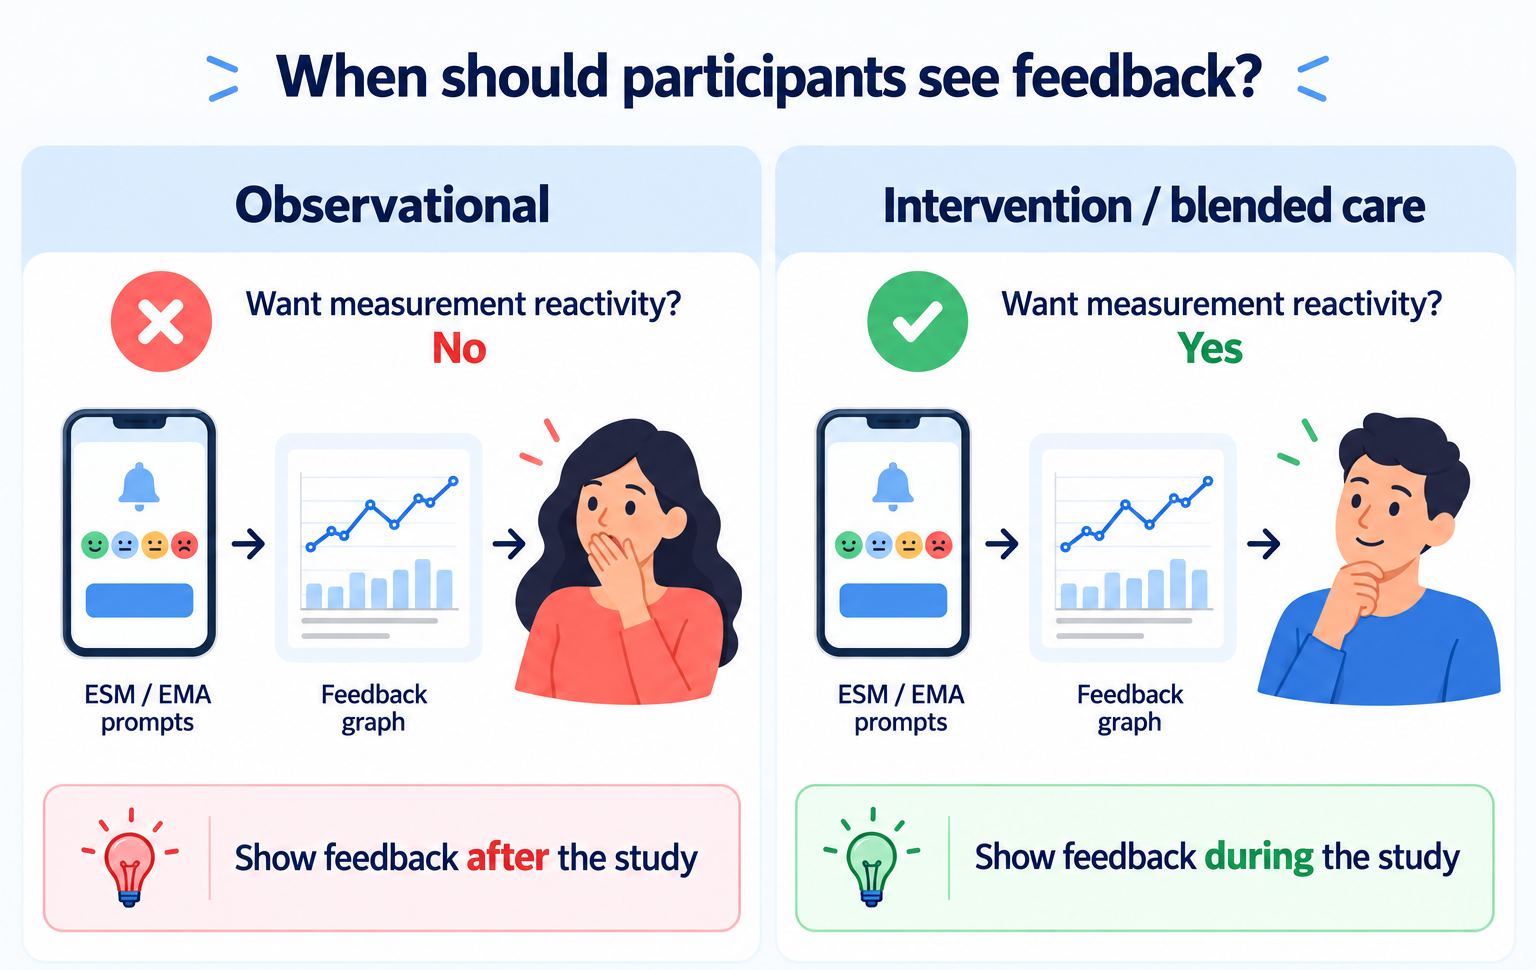
Feedback may induce measurement reactivity in ESM / EMA.
Which personalized feedback fits your ESM / EMA study?
There is no reason to build the most sophisticated feedback option by default.
Start with the purpose of your feedback. Then ask what participants need to see to get something useful from their data.
The table below can help you decide which type of feedback is most suited.
|
|
Standardized in-app graphs |
Custom in-app graphs |
Personalized dashboard |
|---|---|---|---|
|
Easy to access |
✅ |
✅ |
🟠 |
|
Low development effort |
✅ |
❌ |
🟠 |
|
Real-time visualization |
✅ |
✅ |
✅ |
|
Tailored to the participant |
❌ |
✅ |
✅ |
|
Highlights meaningful patterns |
🟠 |
✅ |
✅ |
|
Possible reactivity |
🟠 |
✅ |
✅ |
|
Suited for blended care research |
❌ |
🟠 |
✅ |
Want to experiment with personalized feedback in your next ESM / EMA study? m-Path supports built-in feedback, custom R-generated visualizations, and personalized dashboard workflows, so you can choose the approach that fits your research design.

Dr. Egon Dejonckheere is an Assistant Professor at Tilburg University, affiliated with KU Leuven, specializing in ambulatory assessment and intensive longitudinal research.
His work combines methodological innovation to improve these methods with applications in mental health and emotion dynamics, and includes dozens of smartphone-based studies in daily life.