
01.
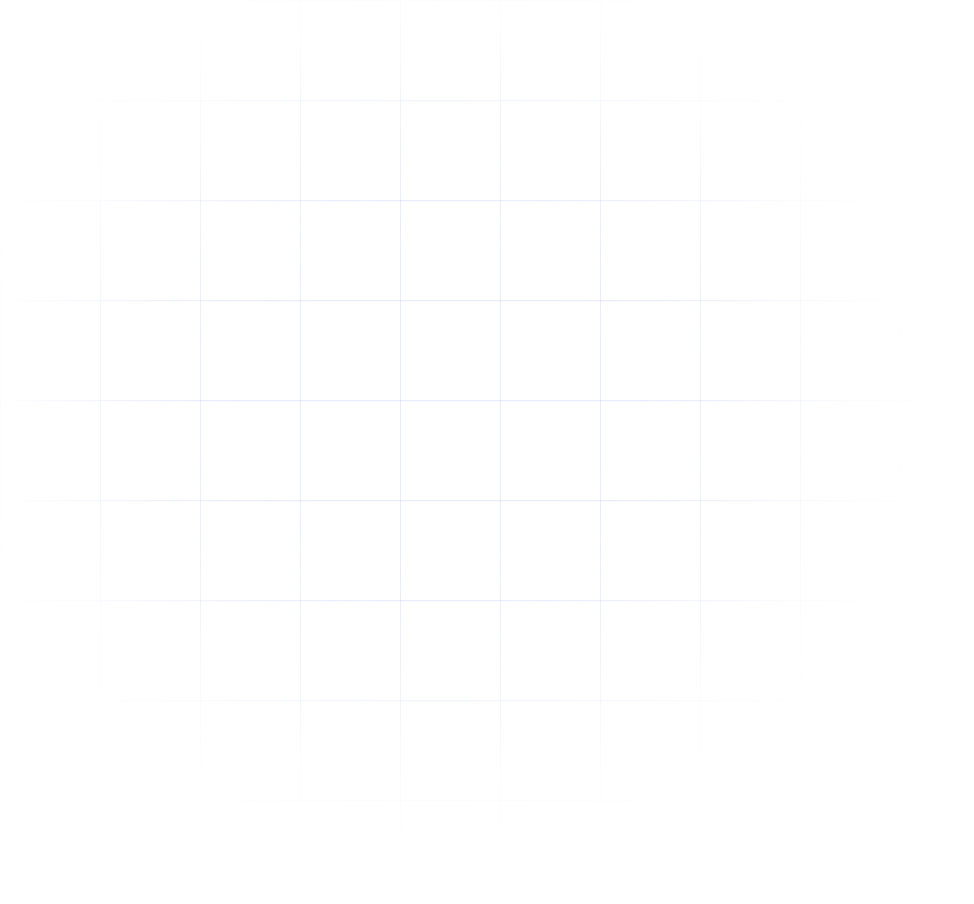
Combine different graphs into a single visual workspace. Our dashboard supports case conceptualization, helping therapists and SCED researchers explore individual triggers and change patterns.
02.
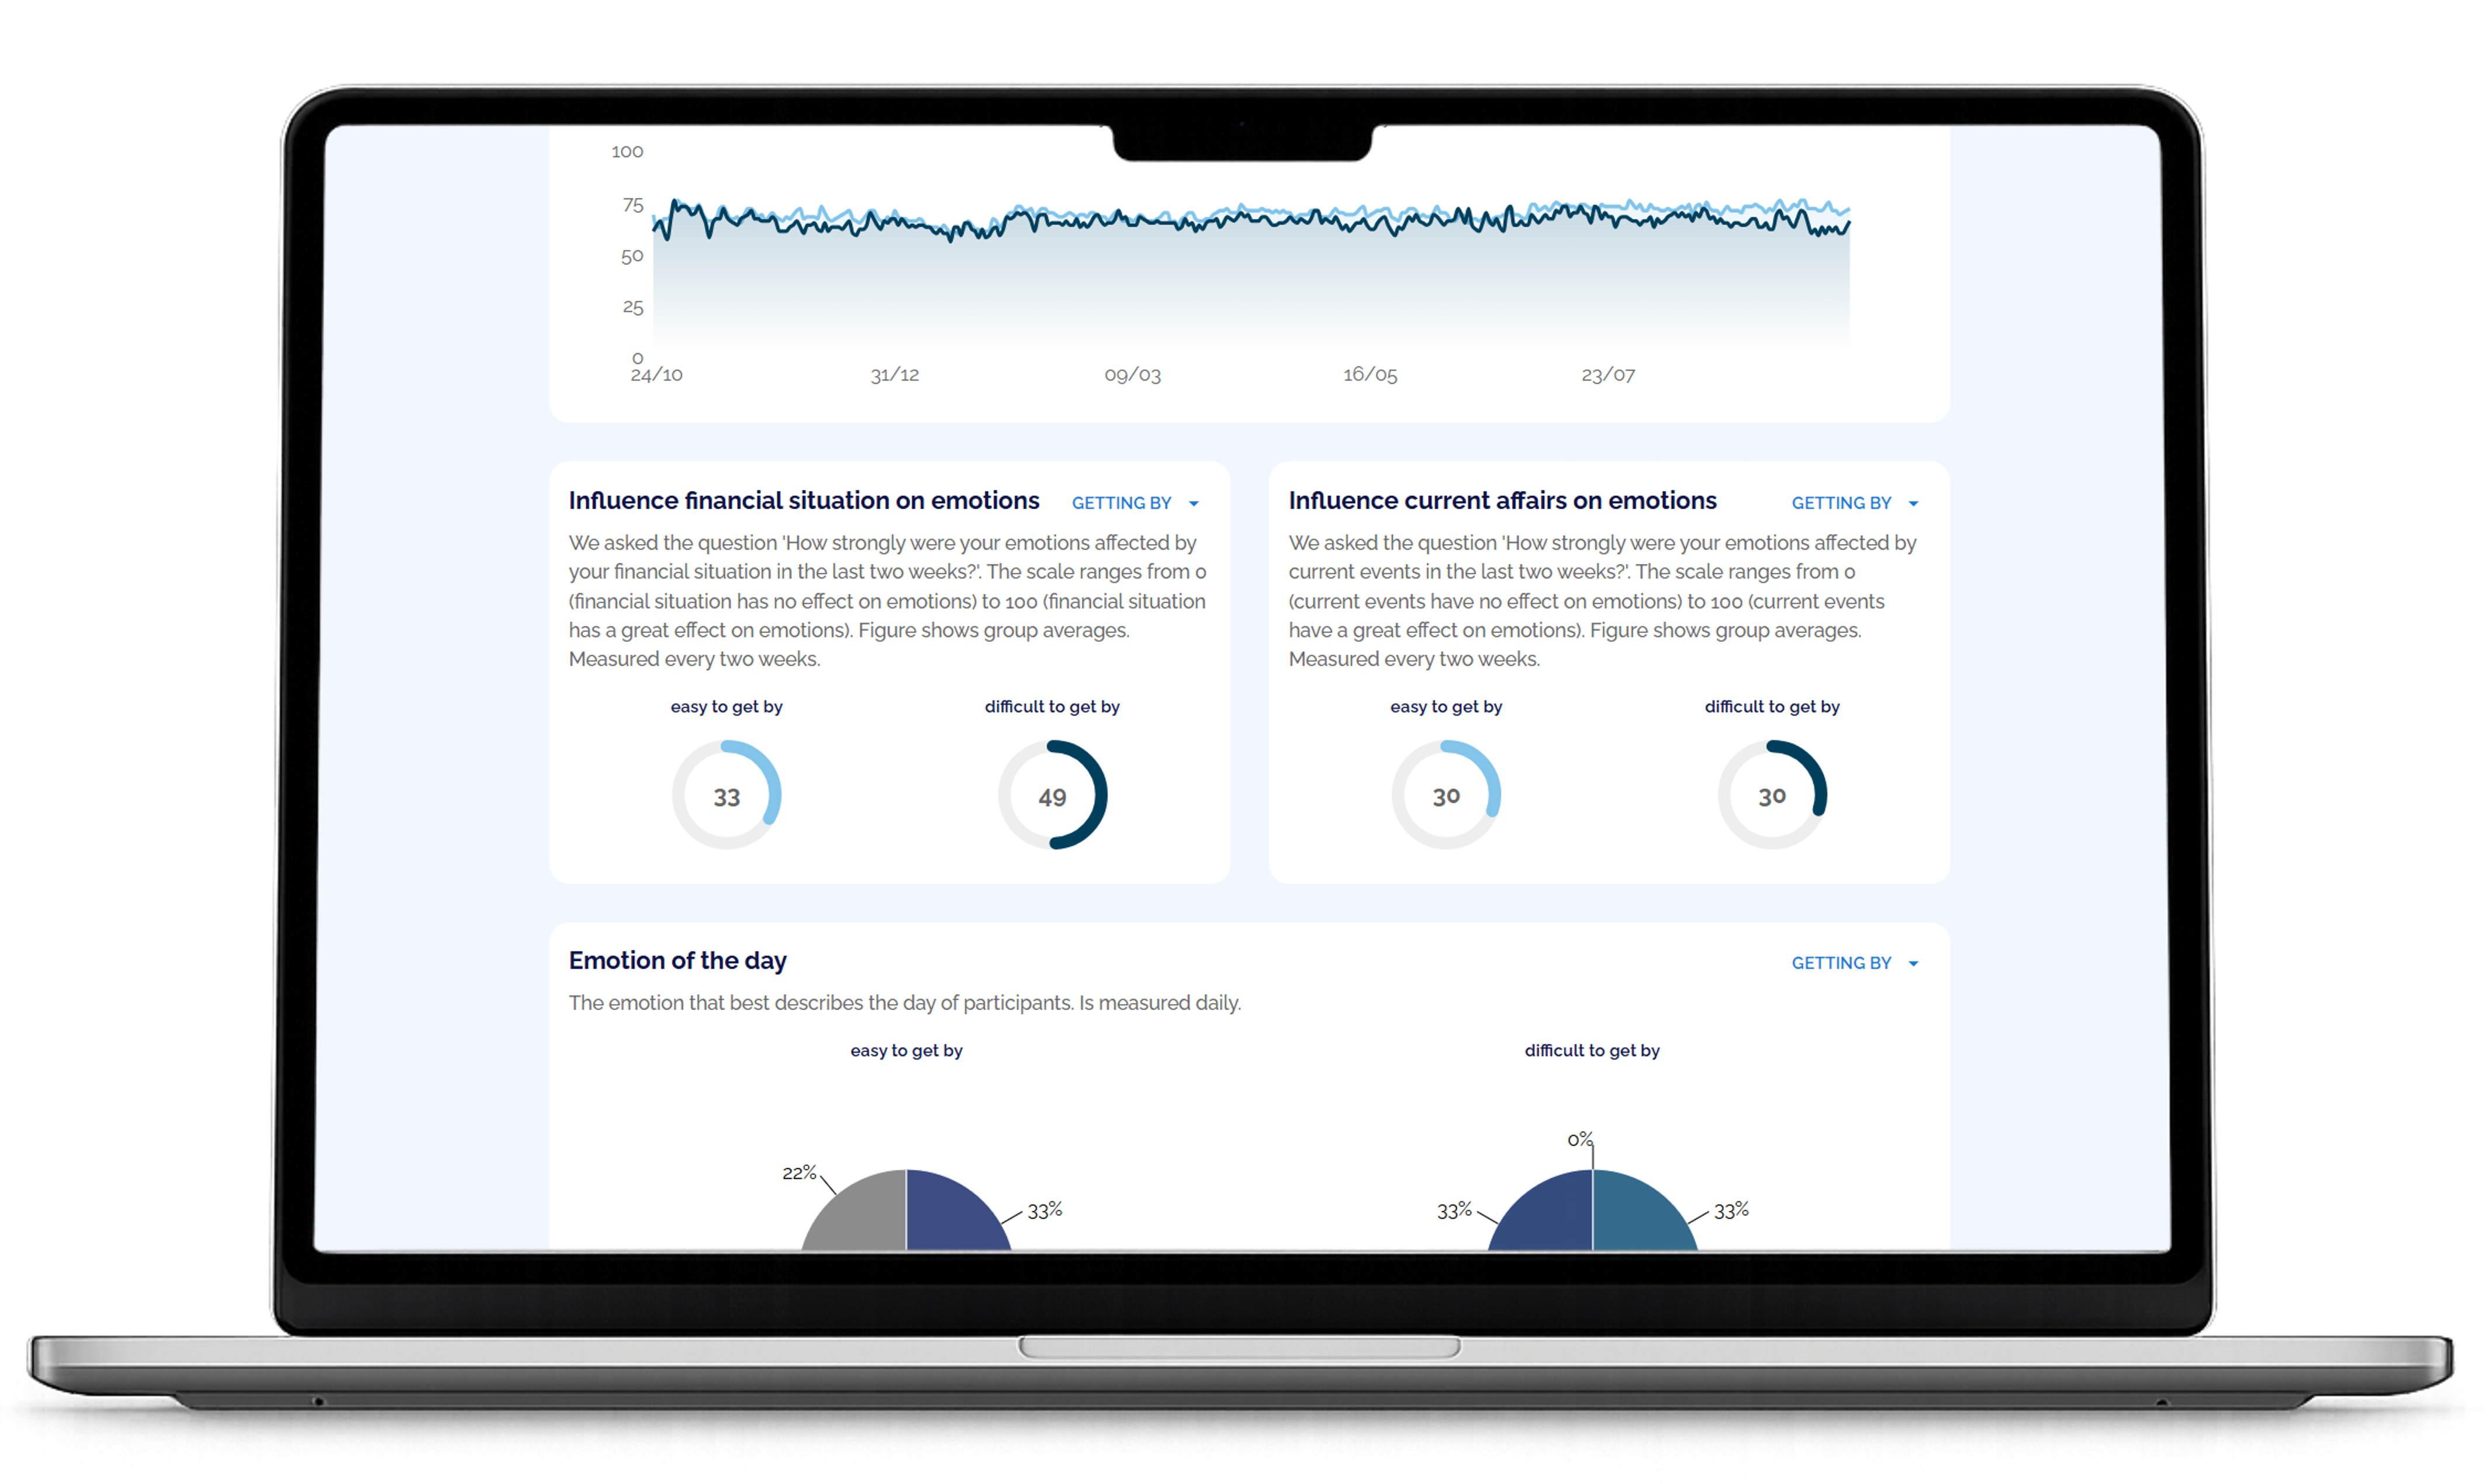
Combine premade visualizations in a fixed moodboard, linked directly to your survey. This is ideal for blended-care research, allowing clinicians to focus on interpretation rather than configuration.
03.
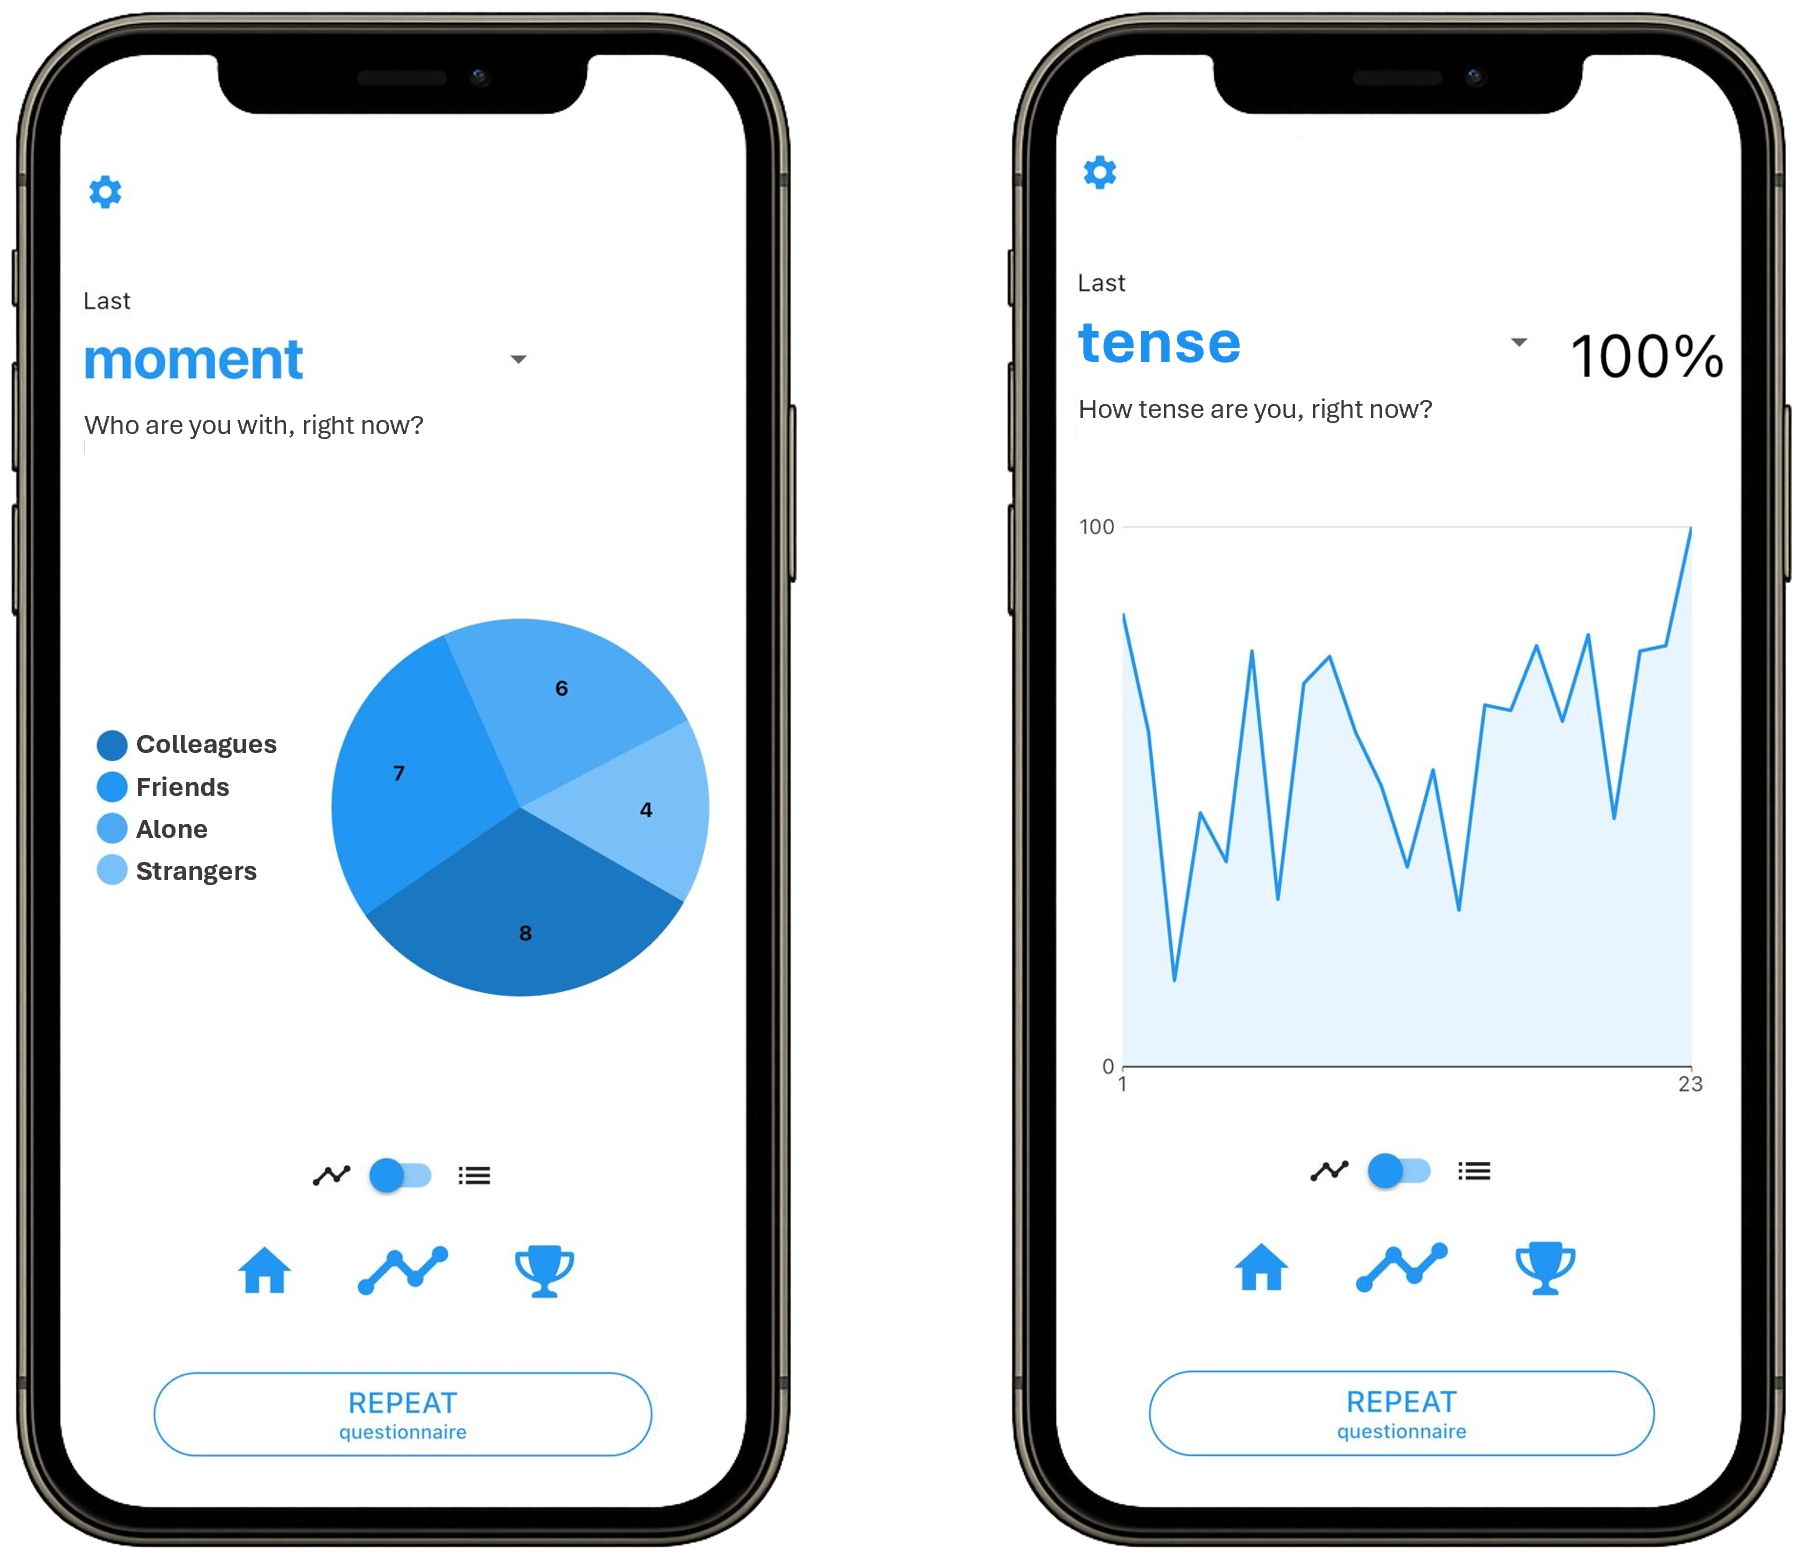
Enable simple graphs integrated into the m-Path app. This supports insight into individual patterns and strengthens intrinsic motivation over time.
04.
On request, m-Path collaborates with researchers to design custom study pages where participants can view individual responses or aggregated group-level results as part of citizen science projects.
Inspect how ratings evolve over time. Zoom into specific windows and hover over meaningful moments for closer inspection.
Summarize data using means, distributions, and response frequencies to support quick interpretation of overall patterns.
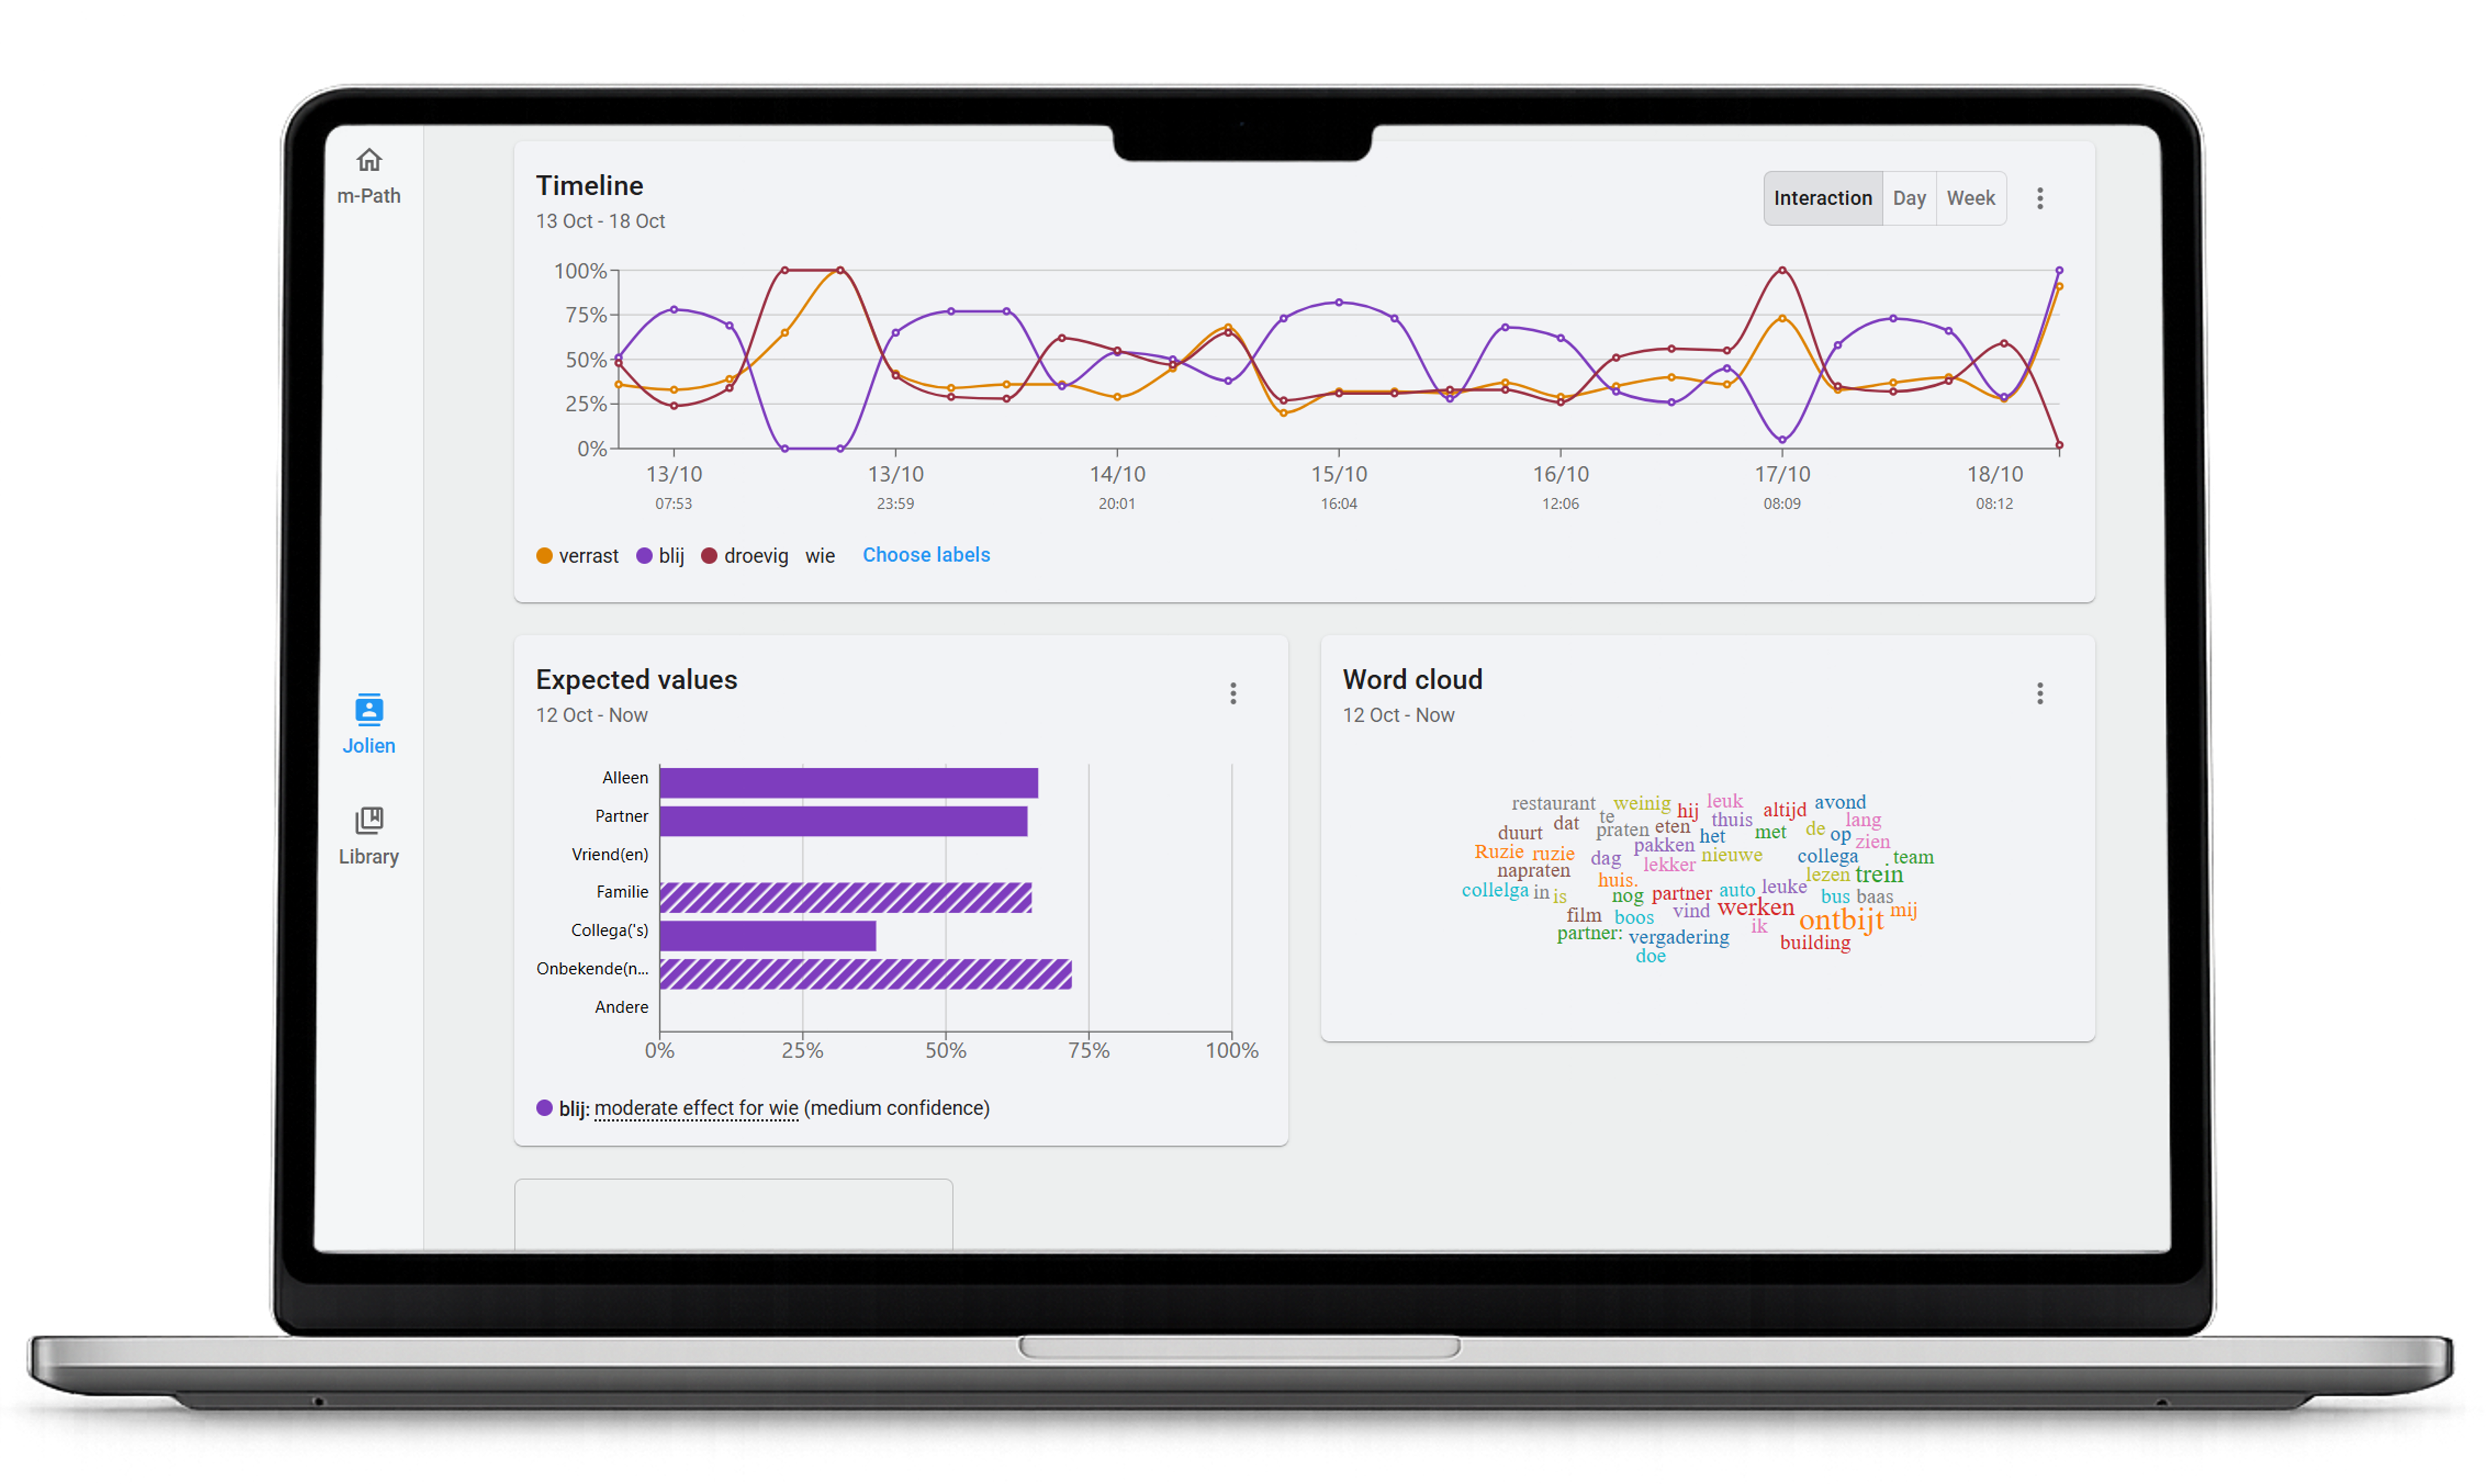
Examine how ratings relate to contextual factors such as location, activity, or situational variables.
Compare selected time periods to assess change, stability, or intervention-related differences over time.
Structure and summarize open-ended responses by visualizing frequently used words and themes.
Explore relations between variables using network graphs to study co-occurrence and interdependencies.
Identify recurring patterns across days of the week to reveal routine-related fluctuations and rhythms.
Work with our team to design tailored visualizations aligned with your specific research question.
Store interactive graphs in the dashboard or export static figures as PDFs for reporting, collaboration, or further analysis.

Looking to extend your psychological treatment beyond the therapy room? Boost your therapeutic impact by complementing face-to-face sessions with mobile assessments and interventions. Get unbiased insight into your client’s daily routine and foster lasting therapeutic change with real-life exercises and relapse detection.

Message us and we will do our best
to answer you.